
Workiva
We designed an AI-driven tool for detecting anomalies in spreadsheet data tailored for Workiva’s enterprise platform, helping users identify outliers and inconsistencies with ease, boosting data confidence and team decision-making. Built during a hackathon sponsored by Workiva, we took 2nd place among 30+ teams.
.png)
.png)
.png)
THE Problem
Spreadsheet users struggle to efficiently detect errors and anomalies in data. Their current process relies heavily on manual checks, making it slow and prone to oversight. While AI can streamline detection, users prefer to rely on their own expertise and institutional knowledge to maintain control and credibility.
THE Solution
Users need a tool that supports their decision-making without taking control away - so they can verify, validate, and act with confidence.
Rather than automating decisions, we created an AI anomaly detection tool that functions as an AI assistant, highlighting errors and patterns, but allowing users to use their organizational expertise to make the final decision, ensuring efficiency without compromising agency.
THE Impact
By designing a solution where AI serves as an assistant - not the decision-maker - we empower users with the confidence and authority to make the final call, ensuring they retain credibility and ownership with their team and company.
THE CHALLENGE
Workiva challenged us to create an AI-driven tool that flags unusual patterns in spreadsheet data, making it easy for anyone to spot issues without advanced technical skills.
Spreadsheets are essential for managing data, but detecting errors or anomalies is often manual, time-consuming, and error-prone. Existing tools either lack native anomaly detection or demand technical expertise. To understand gaps and user needs, we conducted competitor analysis and user research.
THE DISCOVERY
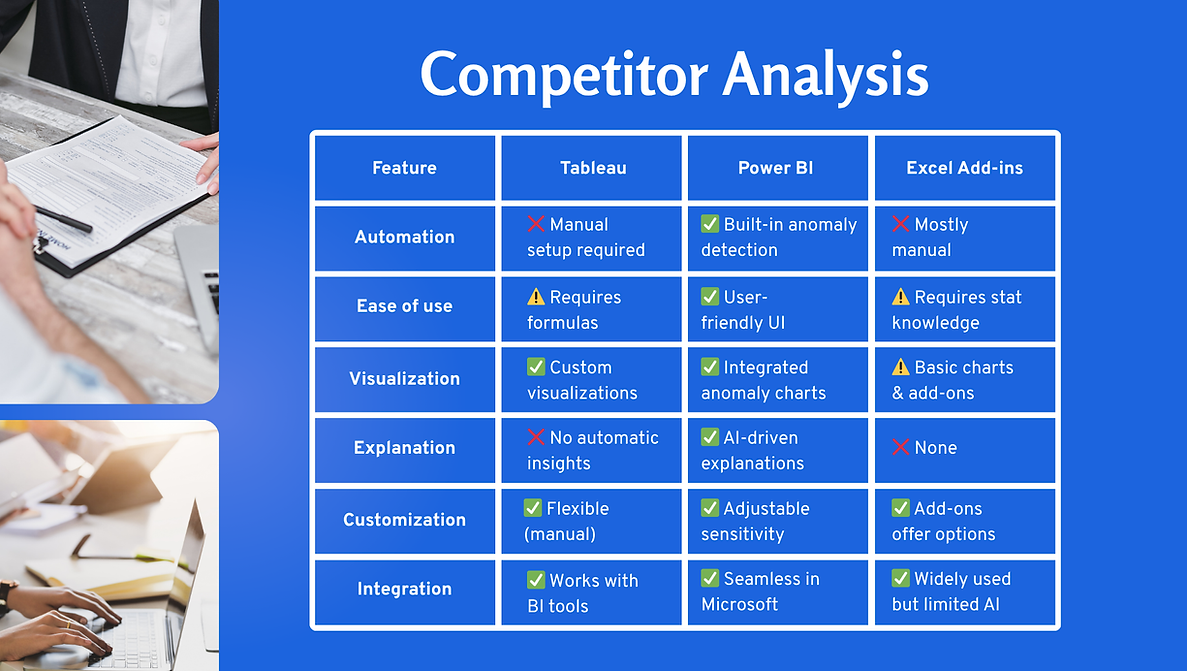
We began with a competitor analysis of Tableau, Power BI, and Excel Add-ins. Key gaps included limited anomaly support, complex setup, and lack of transparency.
First, we conducted a competitor analysis, reviewing popular platforms like Tableau, Power BI, and Excel Add-ins.
Some key takeaways from our research showed that Tableau is powerful, but requires manual setup and data knowledge with no built-in anomaly detection.
Power BI is best with automation with AI-driven explanations, making it the most accessible for non-experts.
And finally, Excel has Add-ins that are widely used but lacks native anomaly detection, relying on third-party tools and manual setup, which may not be ideal for beginners.
Our industry research showed that Workiva had a great opportunity to stand out in key areas:
1. Providing insights into WHY an anomaly occurs
2. Provide a tool with minimal setup
3. Make anomalies instantly recognizable, and
4. Allow workflow integration.
AI Powered Insights: Go beyond detection & explain why an anomaly occurs
Beginner-friendly Usability: A no-code solution that requires minimal setup
Adaptive Visuals: Make anomalies instantly recognizable within spreadsheets
Workflow Integration: Enable users to address anomalies at their convenience without disrupting immediate workflow
Next, we decided to go straight to the users and get their opinions on using spreadsheets. We were interested in learning about their habits, understanding their general attitudes, and how they feel about their current spreadsheet workflows.
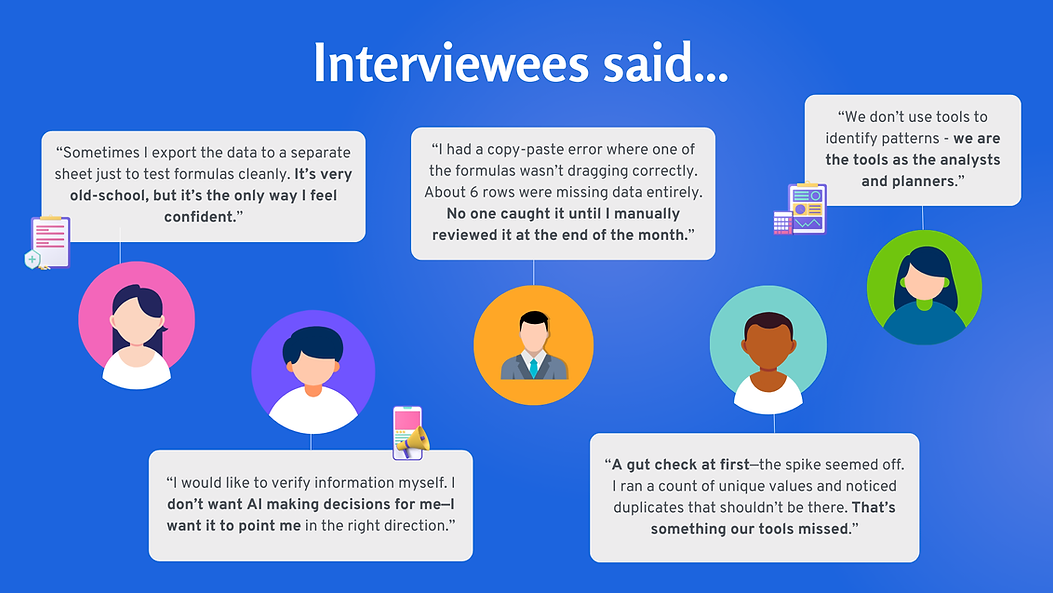
We also conducted a survey to gather additional user insights and found that the majority of participants would use AI in their spreadsheets, although some noted they would need to gain trust first.
Users also expressed a desire to dismiss AI suggestions once they appeared.
.png)
Putting their feedback together, we created an affinity map to make sense of our data and developed a persona to synthesize and communicate our users' thoughts.
We found some recurring themes that revealed they:
1. Rely on checks and balances
2. Depend on formulas
3. Need accuracy to build trust and credibility
4. Value time
5. Detect errors manually
But the most prominent & recurring theme revolved around the need for control.
THE Definition
Users emphasized the value of using their “gut” or “intuition” to troubleshoot errors & valued their own experience and company knowledge to make the final decisions.

Next, we created a persona to highlight Workiva's key user needs, pain points, and goals, ensuring our design decisions stayed grounded in the real challenges analysts face.
.png)
Meet Luke. He's a sales rep with tight deadlines who uses spreadsheets to track clients, revenue, and financial overviews. He is a team player who works with his teammates to verify data.
He finds that he and his team struggle to keep formulas intact and run into errors that are easily overlooked. Luke wants to be able to validate the data himself to feel in control, and ultimately maintain credibility with his team and leadership.
Putting all these insights together, we were able to define the problem statement.
.png)
With our main user problem in mind, we began brainstorming by asking ourselves how we might begin tackling Luke's problem.
.png)
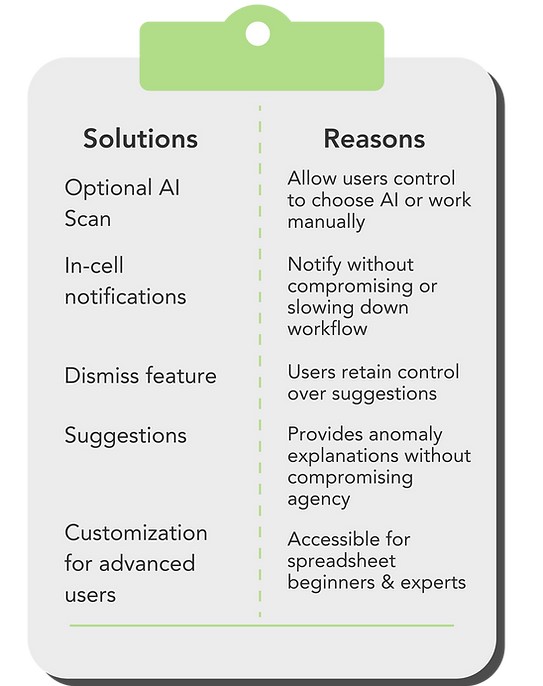
This line of questioning brought us to brainstorm some tangible solutions. Then, I created an MSCW chart to prioritize the features and solutions we could implement into the website redesign.
A few solutions included adding an optional AI scan to allow users control to choose AI or continue their workflow manually, adding in-cell notifications to avoid compromising or slowing down workflow, a dismiss feature so users retain decision making control over suggestions, a suggestions feature to provide anomaly explanations without compromising user agency, and finally, a customization AI feature for advanced users so that the AI detection tool is still accessible for beginners, but allows room for tweaking for experts.

.png)
After defining Luke's problem and brainstorming solutions, I generated a solution statement.
.png)
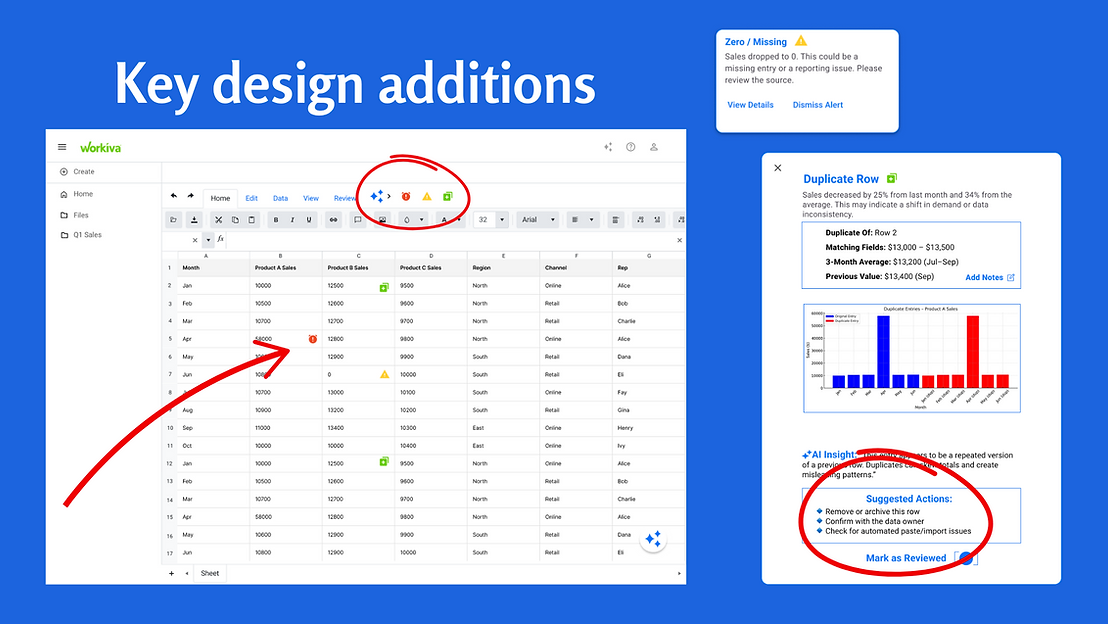
Below is a snapshot of key designs for AI anomaly detection feature. We added Workiva's AI icon to the toolbar, so users can scan the page for potential anomalies. This can be done anytime during the user's workflow.
To the right are snapshots of popups that will appear when hovering over the inline icons. These inline icons only appear once the user initiates the scan, so users maintain control over their workflow without being bombarded with notifications.
Users can dismiss the alert or click view details that will generate a detailed inspection, as seen in the bottom right popup. Suggestions will also generate at the bottom, to guide the user towards next steps, without overriding their autonomy, in case users want to go back and inspect for themselves to manually verify and retain control.
.png)
Here is a summary of the customer's journey, starting with initiating the AI scan to confidently reviewing errors and making necessary changes, ultimately retaining control of their spreadsheet's data.
.png)
The Final Deliverable
.png)
.png)
.png)
Project takeaways